
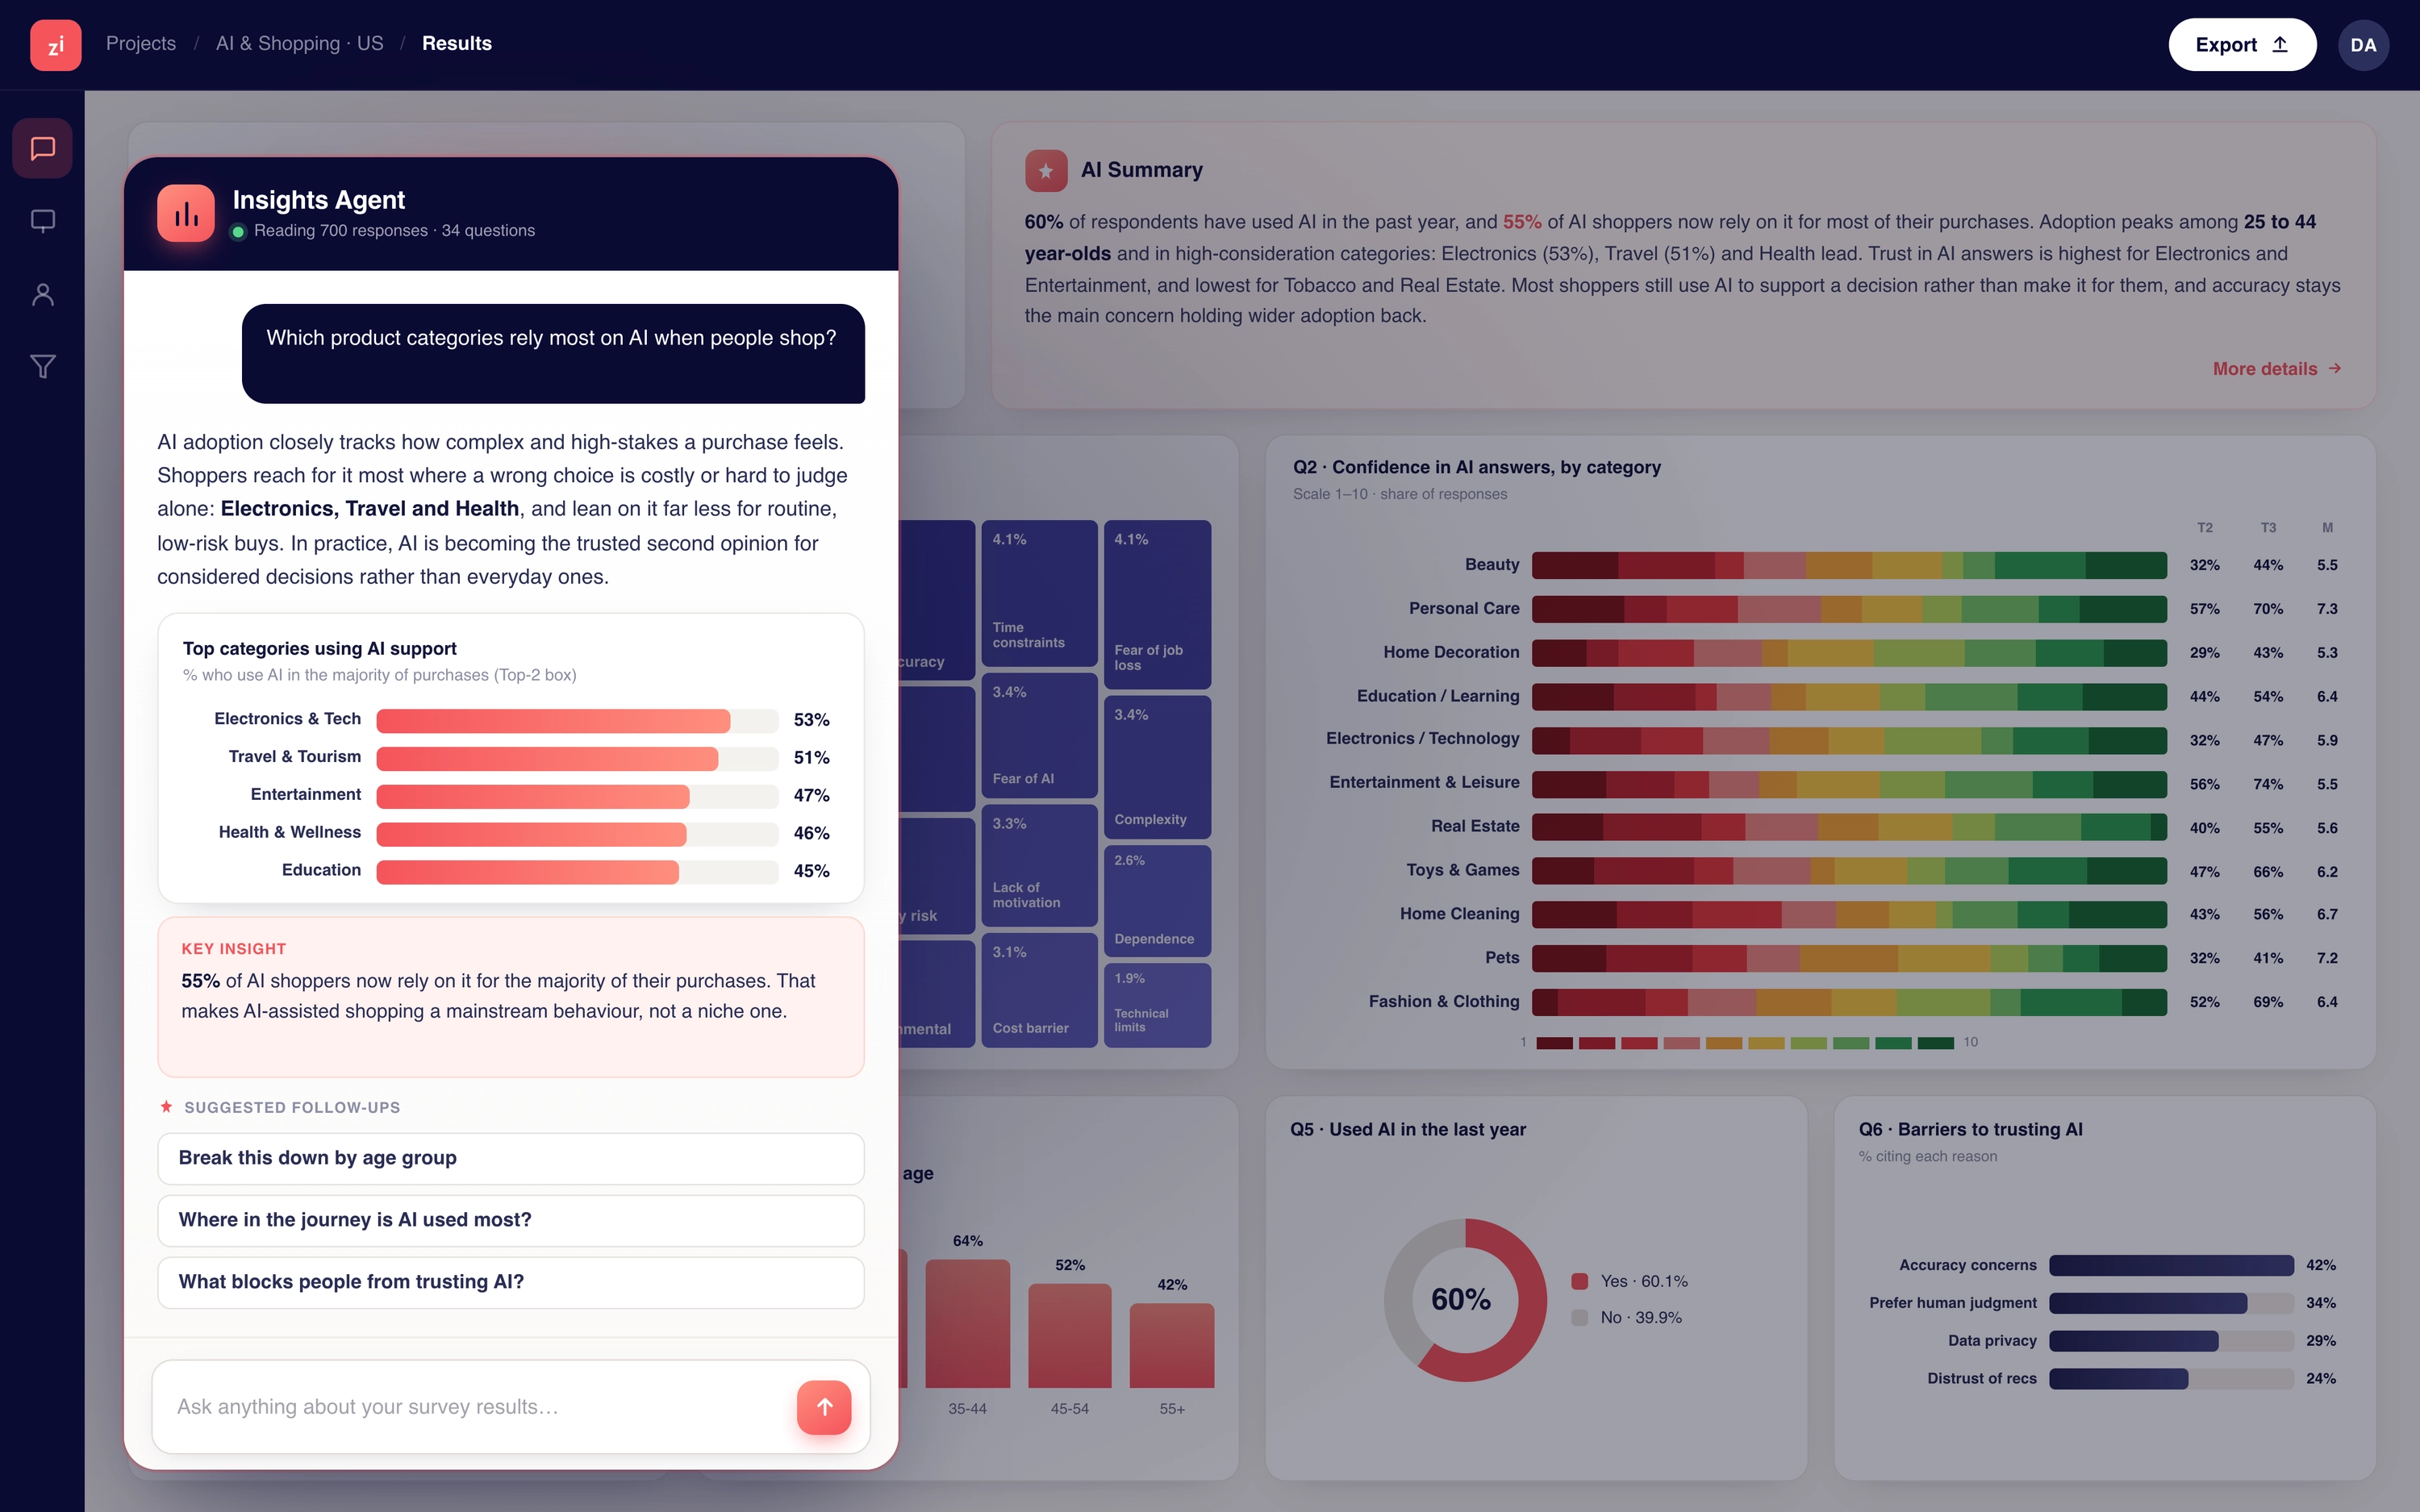
Insights Agent
A conversational analyst that calculates and interprets your data for you.
Capabilities
Reads like an analyst
Answers questions about your study in natural language, not just charts.
Never invents numbers
A deterministic engine runs the maths; the AI only plans and explains.
On the fly
Cross-tabs, segmentations and filters the moment you ask.
Real statistics
Significance testing, key-driver analysis and TURF, run for you.
Quali meets quant
Crosses verbatims and codes with the quantitative results in one place.
Proactive and exportable
Surfaces patterns, suggests follow-ups, and outputs text, tables (CSV) and charts (PNG).
What it can do
Ask in plain language
Ask any question of your study the way you would ask a colleague, and get a direct answer instead of a dashboard to dig through. The results page becomes a conversation, not a maze of tabs.
Anyone on the team can interrogate the data, not just the person who built the tables.
Never invents numbers
A deterministic engine runs the maths; the AI only plans the analysis and explains the result. So every figure is reproducible, auditable and yours to defend, never a plausible-sounding guess.
The intelligence is in the interpretation, never in the arithmetic.
Cross-tabs on the fly
It builds cross-tabs, segmentations and filters the moment you ask, with no setup and no waiting. Follow a hunch the second you have it, then follow the next one it raises.
The analysis keeps pace with your curiosity instead of slowing it down.
Real statistics, run for you
Significance testing, key-driver analysis and TURF run on demand, without exporting to a separate tool or briefing a stats team.
Rigorous methods are one sentence away, with the result explained in words you can use.
Quali meets quant
It crosses verbatims and codes with the quantitative results in one place, so the why and the how-much sit side by side. The hybrid study finally reads as one, instead of two disconnected reports.
You can jump from a number straight to the voices behind it.
Proactive analyst
It surfaces patterns and suggests follow-up questions before you think to ask them, like an analyst reading over your shoulder. It points to the segment that behaves differently, the driver that matters most, the thing worth a second look.
The insight you would have missed gets raised, not buried.
Exportable outputs
Answers come as text, tables (CSV) and charts (PNG), ready to drop straight into your deck or your workflow. There is no rebuilding the chart you already saw on screen.
What you explored is what you export.
LET'S TALK
Bring a question. Leave with the answer.
Tell us your question and we'll show you the whole arc, end to end.